

Overview
Each week on Friday, we post a social media challenge known as “Detective Nevil Mystery Challenge”. On November 13th of 2020, we released a challenge that contained a payload and it was only solved by one person on twitter. That challenge is as follows:

I decided it might be a good idea to do a blog post to serve as a small write-up or walk-through to explain how to solve the challenge using a fresh Kali Linux VM in hopes that others may be able to learn something new from this challenge.
Obtaining the Payload
There are two ways to obtain the payload. You could transcribe it from the image itself, or use the download link we later provided on twitter (https://tiny.si/challenge-payload-nov2020.txt) via a web browser or tools such as wget, curl, etc. In my case, I decided to use wget to download it to my ~/Downloads folder.
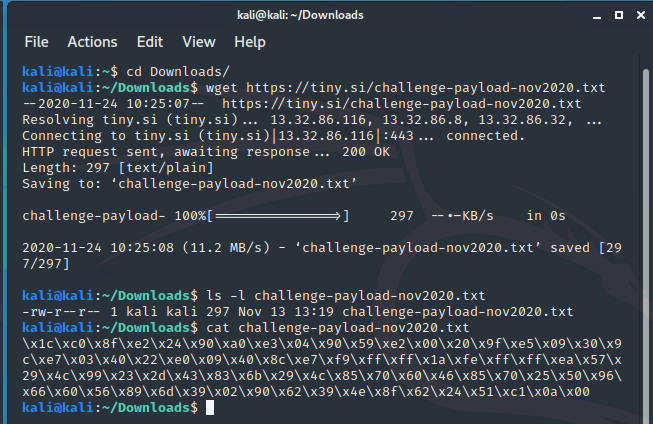
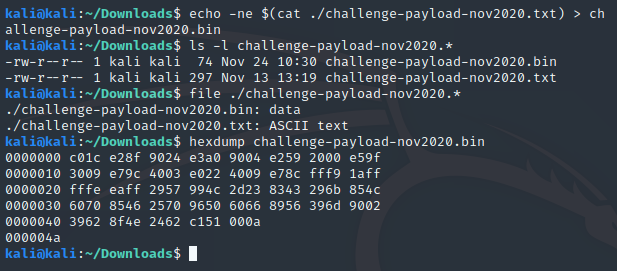
Once it’s downloaded, the next thing we might want to do is convert it into a binary blob since it’s a text based payload. This is pretty straightforward to do from the command line in a Bash shell using the following command:
$ echo -ne $(cat ./challenge-payload-nov2020.txt) > challenge-payload-nov2020.binYou should be able to verify that it was successful if the resulting challenge-payload-nov2020.bin file is 74 bytes in size. You can also use the hexdump command to verify that it is binary data as well like the screenshot below.
Determining the Payload Architecture
Since we have just a binary payload and not a full binary/application, there aren’t any headers that would explain the architecture surrounding the payload. This context is important to determine first since it will affect how we analyze the payload going forward. For this, I’m going to install Pwntools since it has some nice functions that make it useful for disassembling different architectures. The Github page has instructions on how to install it, but this is what I used on the Kali VM:
sudo apt-get update
sudo apt-get install python3 python3-pip python3-dev git libssl-dev libffi-dev build-essential
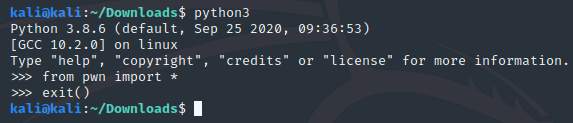
sudo python3 -m pip install --upgrade pwntoolsOnce it is installed, you can test it by invoking a python3 shell and trying to run the following:
from pwn import *If that doesn’t throw an ImportError, then you should be good to go.
Next, in order to use the disasm() function in pwntools for different architectures, you will need to install several different architectures of binutils. There is a binutils-multiarch, but it would miss several of the objdumps we might want to use right now, so we will install several manually ourselves using the following command:
sudo apt install binutils-aarch64-linux-gnu binutils-arm-linux-gnueabi binutils-arm-linux-gnueabihf binutils-arm-none-eabi binutils-avr binutils-bpf binutils-i686-gnu binutils-m68k-linux-gnu binutils-ia64-linux-gnu binutils-mipsel-linux-gnu binutils-mips64-linux-gnuabi64 binutils-mips64-linux-gnuabin32 binutils-mips64el-linux-gnuabi64 binutils-mips64el-linux-gnuabin32 binutils-mips-linux-gnu binutils-powerpc64le-linux-gnu binutils-powerpc64-linux-gnu binutils-powerpc-linux-gnu binutils-riscv64-linux-gnu binutils-s390x-linux-gnu binutils-sh4-linux-gnu binutils-sparc64-linux-gnu binutils-x86-64-linux-gnu binutils-docNow that we have Pwntools installed and binutils for multiple architectures, let’s create a script to cycle through several architectures and attempt to dump the disassembly for those architectures and attempt to determine which architectures look the most promising. The script I created for this purpose can be downloaded from the Secure Ideas Professionally Evil GitHub repository, but it should look like this:
#!/usr/bin/env python3
# -*- coding: utf-8 -*-
"""

Program: multi-arch-dump.py

Date: 11/24/2020

Author: Travis Phillips

Website: https://github.com/ProfessionallyEvil/writeup_11_13_2020_challenge

Purpose: A simple script that will take an argument in as a file path
         and will run it through a loop that will attempt to dump the
         disassembly for it on multiple architectures.

"""
import sys
from pwn import *

def main(args):
    """ Main program logic """
    # Check that the user provided an argument or print usage.
    if len(args) != 2:
        print("\n\t[*] Usage: {0:s} [bin_file]\n".format(args[0]))
        return 1

    # Get the payload binary data.
    with open(args[1], 'rb') as fil:
        payload_data = fil.read()

    log.info("Payload size: {0:d}".format(len(payload_data)))
    log.info("Payload hexdump:")
    print(hexdump(payload_data))

    # Run the payload through the disassembly Gauntlet.
    for key, val in pwnlib.context.ContextType.architectures.items():
        print("\n\t..::[ Disassembly as {0:s} ]::..\n".format(key))
        with context.local(arch = key):
            try:
                print(disasm(payload_data))
            except pwnlib.exception.PwnlibException as e:
                log.failure(e)
            except Exception as e:
                log.failure(e)
    return 0

if __name__ == '__main__':
    sys.exit(main(sys.argv))
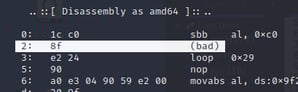
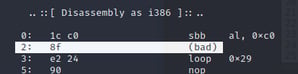
Running this script will likely throw errors for the odd architectures, however it will work for several and you can scroll through them and attempt to find the likely architecture from the output. Based on the output, we can rule out x86 or x64 payloads since both have bad instructions early in the payload:
 |
 |
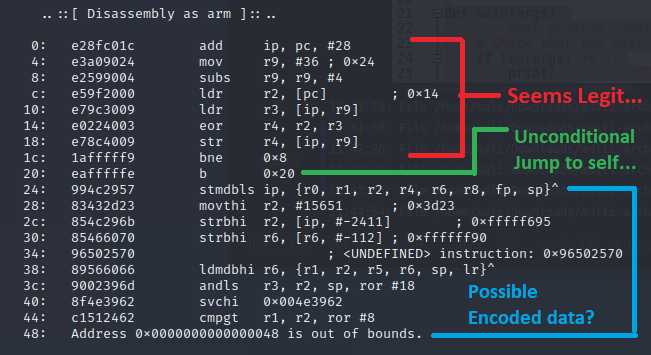
My next choice, which looked promising was ARM, which looked alright, except the end seemed a little weird, but there is supposed to be a hidden message, so we will keep in mind that there could be a portion of the payload which could be an encoded message, and this happens after an unconditional jump instruction that jumps to itself, which would be an infinite loop.
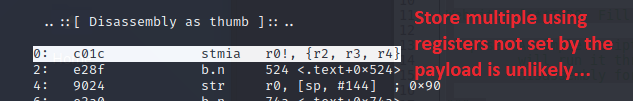
After that I would look at the thumb instructions as well; this one has errors and the first instruction is a store multiple instruction using registers which haven’t been set yet, so unlikely to be the right architecture.
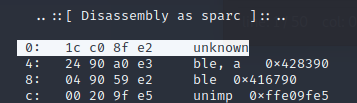
Aarch64, PowerPC, and MIPS all seemed to either fail to disassemble or were non-sense instructions that didn’t look like they’d do anything useful, or just crash due to access errors. Sparc architecture had an unknown instruction as it’s first instruction so we’ll write Aarch64, Sparc, PowerPC, and MIPS off.
At this point, ARM seems to be the most promising candidate for analysis, so we will continue forward assuming that’s what it is.
Loading the Payload into a Tester Stub
There are several ways to proceed here. You could make use of the Unicorn Engine in Python to emulate it or put it in an ELF binary for static or dynamic analysis. I’m going to opt to put it into an ELF binary for dynamic analysis. There are shellcode tester stubs written in C that can be found online, however we are going to just load this into an assembly source code file as raw bytes and let it run. The reason I opt for this instead of the C stub is I won’t need to set up any of the ARM glibc dependencies or binfmt stuff if it’s built without those dependencies on it, which is what building it as assembly will do for us. The template for this also makes it a pretty straightforward process to build.
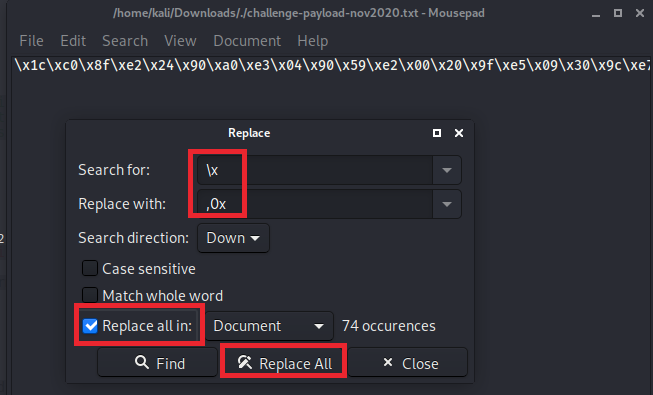
To do this, I would start with the text version of the payload, the challenge-payload-nov2020.txt file we used wget to obtain and open it with the editor of choice. On Kali, the default for the XFCE4 desktop environment would be Mousepad, which can get the job done since we just need to do a find and replace job. Open the challenge-payload-nov2020.txt file in Mousepad and hit ctrl+r to open the Replace dialog. We are looking to replace the “\x” with “,0x” so it will be formatted correctly for being dropped into an assembly source code file.
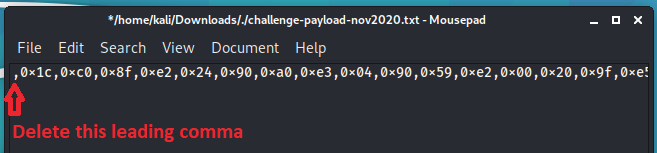
Once you run the replace, there will be a leading comma at the start of the string you will need to delete.
Now you can copy and paste it into this ARM shellcode tester template:
#-----------------------------------------------------------------------
# Decode the special message and hang. User will need to get message from
# memory. Runs on 32-bit arm.
#
# Compile & link:
#   arm-linux-gnueabi-as tester.s -o tester.o
#   arm-linux-gnueabi-ld tester.o -o tester
#
#-----------------------------------------------------------------------
.section .shellcode,"awx"
.balign 4

.global _start

_start:
    .byte #Replace this comment with the shellcode
Save this code in a file called “tester.s” and use the following commands to compile and link the code into an ELF binary:
arm-linux-gnueabi-as tester.s -o tester.oarm-linux-gnueabi-ld tester.o -o testerYour shell output should look something like the following:
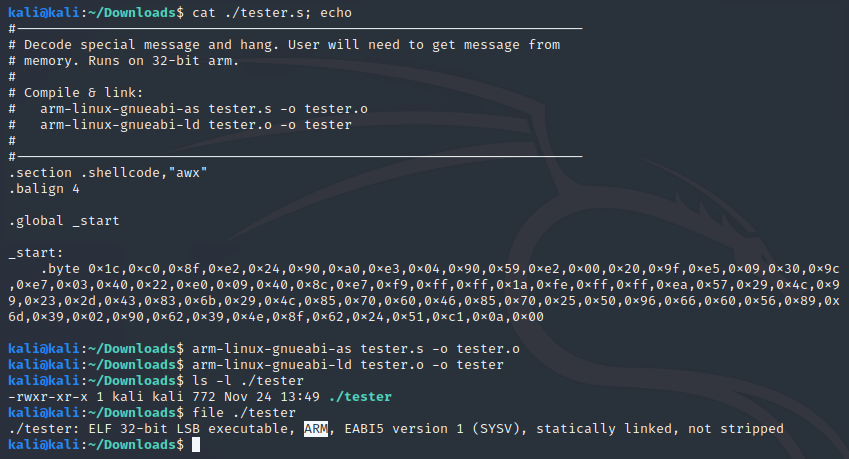
Now that we have the payload packed into an ARM based ELF executable, it’s time to set up our Kali machine to be able to run and debug cross architecture!
Setting up Kali as a Cross Debugging Environment
In order to debug this ARM binary in our x64 Kali VM, we will need to add a few things. Qemu provides us with a way to emulate ARM binaries on our system, and it can even provide us with a gdbserver stub so we can connect to it for debugging. We will also need to install a copy of GDB that is multi architecture. Both of these are tools that are in the repo and easy to install using the following command:
sudo apt install gdb-multiarch qemu-user-staticOnce those are installed, there is one more optional step that I’d take which is to install GEF to make GDB a little nicer to work with.
Enhancing GDB with GEF
This step is entirely optional, but I would recommend installing it as it makes GDB a little nicer to use. It will automatically dump out a lot of useful information each step or breakpoint that occurs. To install GEF, run the following commands:
cd ~/Downloads
git clone https://github.com/hugsy/gef.git
cd gef/
sudo python3 -m pip install -r requirements.txt
echo source ~/Downloads/gef/gef.py > ~/.gdbinit
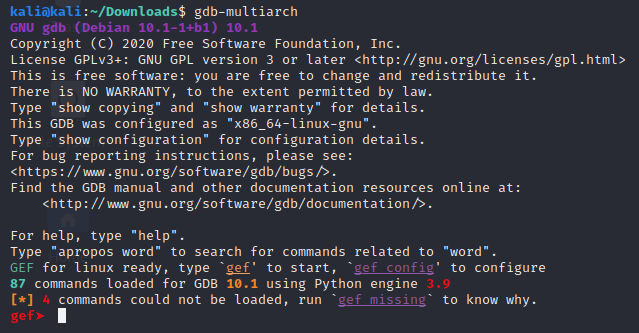
cd ~/DownloadsIf everything went well you should be able to fire up gdb-multiarch and you should see a gef prompt like so:
Stepping Through the Payload to Get the Message
Now it’s time to step through the payload ELF binary we created earlier. For this we will need to fire up two shells; one of them for running qemu with the debugging bridge, the second for running GDB. First let’s stage the first shell for GDB since there is a little setup we can do. Start it up by running the following command:
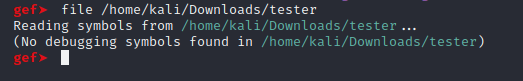
gdb-multiarchYou should get a prompt like the last screenshot. Now we will want to use the GDB built-in file command within GDB to load the ELF payload tester binary file. This will ensure that GDB has all the symbols from the ELF file and can just make the debugging session a little smoother. Below is a screenshot of the file command within GDB successfully loading the tester binary I generated earlier.
Now we will want to start the second shell for running the tester binary with qemu. This is how we will run the ARM binary as well as create a GDB debugging server to connect to it. In the second shell we will run the following command:
qemu-arm-static -g 1234 /home/kali/Downloads/testerThe -g 1234 part of the command tells it to start a GDB server on port 1234 and to wait for gdb to connect to it before running the program. Now that this is in place, we can switch back to our first shell and tell GDB to connect to it with the following command:
target remote localhost:1234Upon running that command, GDB should connect to the GDB server provided by qemu and we can see the GDB debugging session come to life.
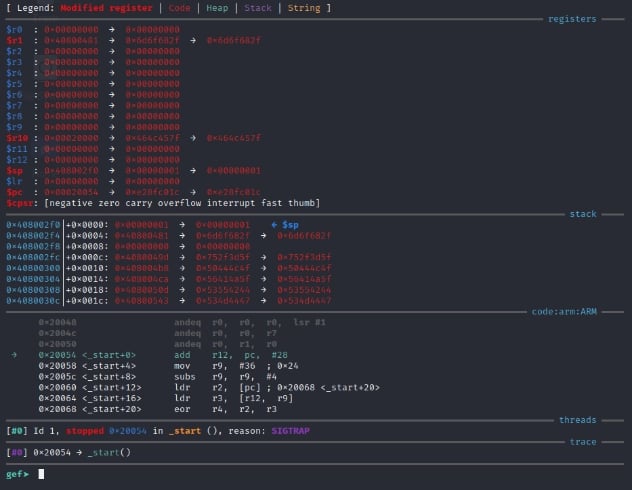
In order to view the entire disassembly, we can run the following command:
disassemble _startWhich will show us a disassembly dump of the code under _start label, which was the entire payload we added to our template.
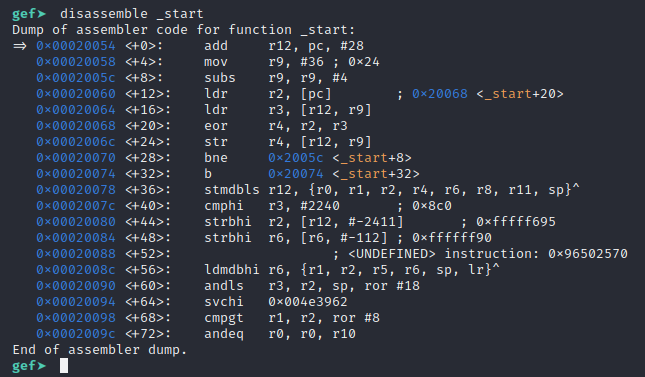
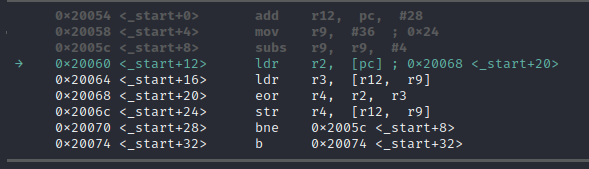
Within GDB, you can use the command si to Step Into the next command. If it had a call to another function, you’d be following into it. However, this code is linear and it’s fine to si through it till we hit the instruction at 0x00020074, which is an unconditional jump (branch) to itself. It would hang on this instruction indefinitely. It also appears that the instruction before it (the bne instruction) branches to 0x0002005c conditionally if the subs instruction (at line 0x0002005c, the s suffix on the sub instruction makes it store flags), so we can assume that 0x0002005c through 0x00020070 is a loop of some sort.
However instead of just running through it to the end without understanding, let’s walk through it and try to understand what’s happening. After all this is a challenge, let’s use it to try to learn something new! There are 2 instructions before the loop. Let’s use the si command twice and see what happens with our registers on those add and mov instructions.
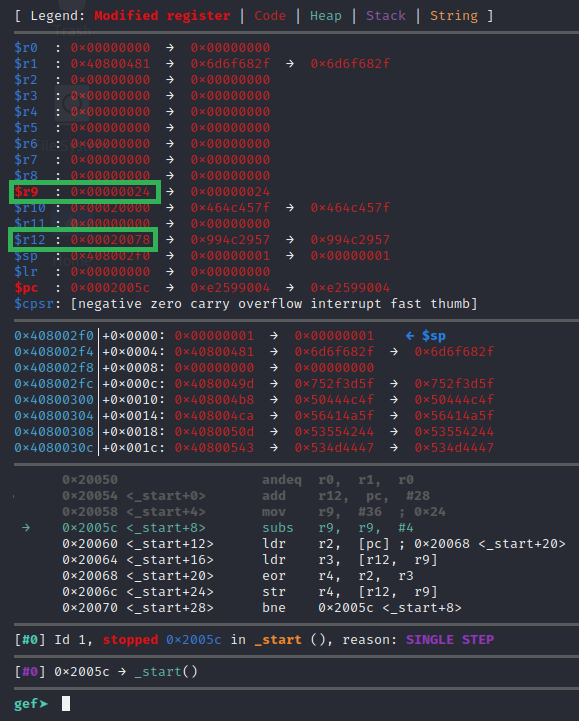
So it set the $r9 register to 0x24, and the $r12 register to point to the address right after the infinite loop instruction, which is where the weird instructions are at, we suspected this was perhaps encoded data. Now at the start of the loop, we can see a subs instruction that will subtract 4 from the value in $r9 and store the result of that math in $r9, but the s suffix on the sub instruction also adjusts flags accordingly. This means the $r9 register is likely being used as a loop iterator countdown since subtracting 4 is a full 32-bit offset length. We can run the si command to step to the next instruction.
The next instruction at 0x20060 is ldr r2, [pc]. This instruction will load the 32 bit value from the address 0x20068 into the register of $r2. $pc is the program counter, it points to the current instruction to be executed, similar to x86 EIP register or x64 RIP register. While ARM allows you to access it as a pointer, the ARM has some odd behavior in that it will actually point at the current address+8. This is just a legacy architecture bug that’s present today for compatibility. Either way, this is looking to load the bytes that make up the eor r4, r2, r3 instruction at 0x20068 into $r2. Let’s continue with the si command to the next instruction and examine the $r2 register.
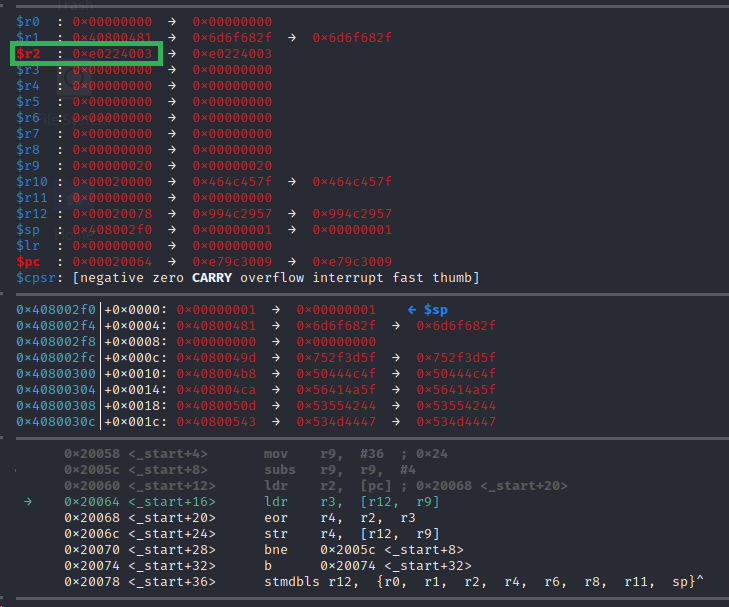
Now that we have stepped to the next instruction we can see that $r2 has 0xe0224003 in it. This would be the bytes stored at 0x20068 in our binary. At this moment, it’s unclear why that was done, but let’s just take note of it and hope that becomes clear later. Let’s take a moment to review the current instruction we are on in the meantime which is ldr r3, [r12, r9]. We at present believe that $r9 is storing some sort of loop iteration counter, and that $r12 is storing a pointer to the weird data that comes after the infinite loop jump instruction that we believe is encoded data. This instruction is going to load the data at address $r12+$r9 into the register $r3. In this iteration of the loop it would be 0x20078+0x20 = 0x20098. This address would be towards the end of the encoded data chunk, the second to the last “instruction” so to speak. We can use GDB to inspect the bytes at this address with either of the two following commands:
x/4xb $r12+$r9
x/xw $r12+$r9
The first command will show 4 individual bytes in hex representation. The second command will show 4 bytes in a hex WORD representation (which a word should be two bytes, but it will show a DWORD really of 32 bits, or 4 bytes). Make sure to take note that the WORD will represent a byte order as it would show up in the registers when displayed to us, where the 4 individual bytes show up backwards. This is because ARM is using little endian. You don’t need to know much about that other than you will reverse the order of data in memory. The screenshot below shows this in effect with both commands for comparison.
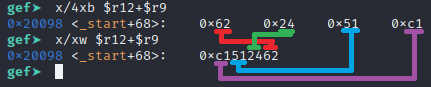
Based on that, it should set $r3 to 0xc1512462 for this iteration in the loop. Be mindful of instructions that make use of the $r9 register in this loop since that is what will be changing throughout the loop. Let’s run the si command and see if that is correct and focus on our next instruction.
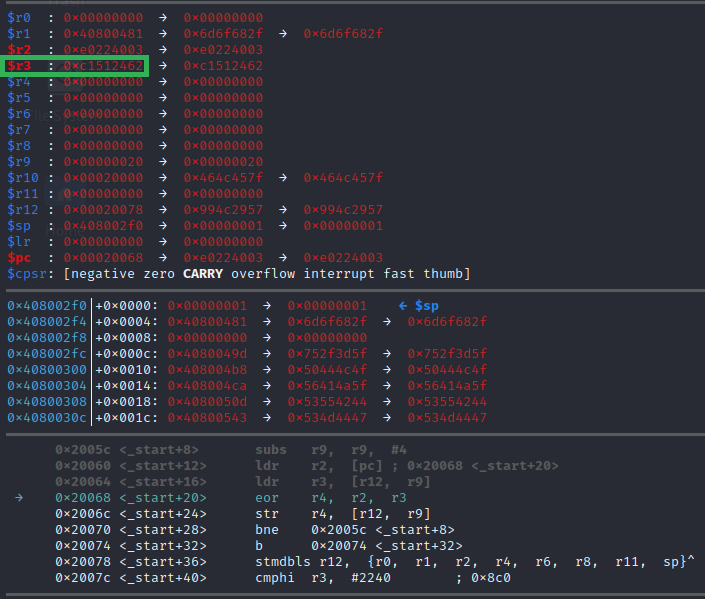
So $r3 was set as we expected to 0xc1512462. The next instruction is eor r4, r2, r3. The eor instruction is actually just an XOR. It’s just a localization difference. We here in the U.S. are used to XOR but in the U.K. it’s EOR. These are both just shorthands for Exclusive OR, which is just a bitwise operation. We have a very well-written blog post covering XOR if you’re unfamiliar with it. This instruction will XOR the value in $r2 (the bytes that make the instruction at 0x20068) and $r3(the data that is pointed at in $r12+$r9), and store it in $r4.
The next instruction we can see in this image above is str r4, [r12, r9]. It will store the value in $r4 into the address of $r12+$r9 which would overwrite the value we read earlier with this new XOR value. It’s now coming together that this loop is a simple XOR decoder stub. The instruction after that is the loop conditional branch of bne 0x2005c, that would restart the loop at the subs r9, r9, #4 instruction which decrements the counter by four, which would be a full 32-bit offset, and it will continue to do that until the subs instruction ends up making $r9 equal zero. That would set the ZERO flag and the bne 0x2005c instruction would no longer jump back to the beginning of the loop.
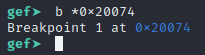
At this point we can see that this loop has a few more iterations to carry out, but it’s basically just going to XOR 4 byte chunks of the encoded message by the value in $r2 which should always load 0xe0224003, so let’s set a breakpoint to where it would exit this loop at address 0x20074 using the following command:
b *0x20074If the breakpoint command was successful, it should show the new breakpoint number and the address it was set to like the image below:
Once the breakpoint is set up, we can now continue running the program by using the command c or continue, which should finish out the loop until it hits the breakpoint, at which point it gives control back to us as shown below.
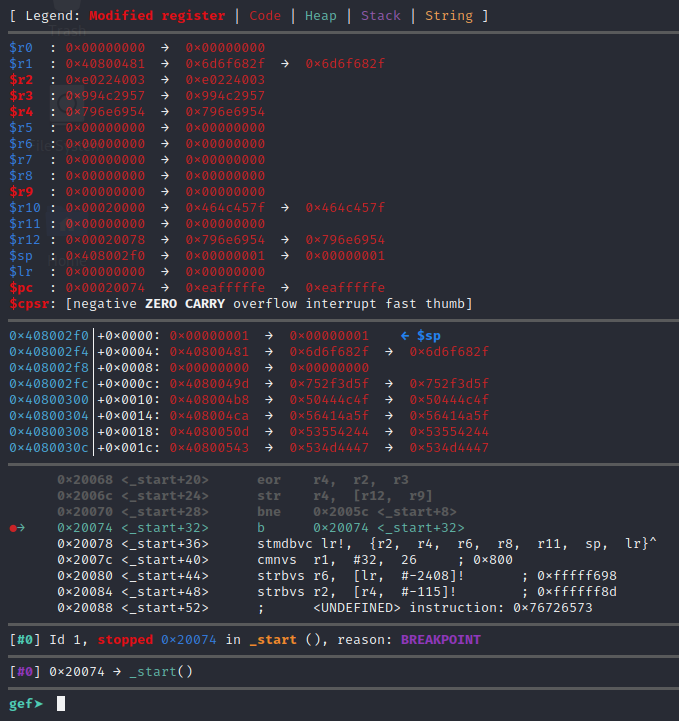
Now that it is stuck on the infinite loop jump instruction, let’s examine the memory that comes after it. The challenge said it should be a message, so let’s hope for a string with the examine command we issue. The decoded data can be addressed directly, or via $r12 since that was set to point to the start of the encoded data at the beginning of the payload and never modified since then, or via $pc+4. Any of the following 3 commands should show you the message:
x/s 0x20078
x/s $r12
x/s $pc+4
The following screenshot shows all three of these commands revealing the final decoded message and the answer to the November 13th, 2020 Detective Nevil Mystery Challenge!
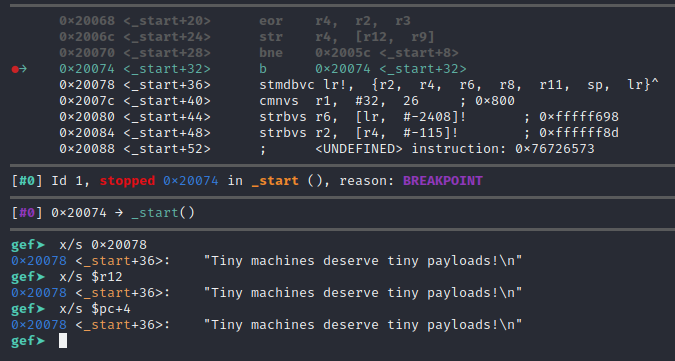
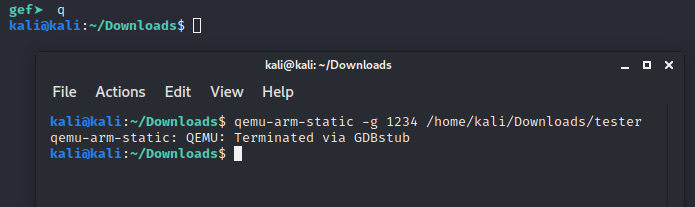
Finally, since we found the answer, we can use the command q or quit to exit GDB. Exiting GDB should also terminate the qemu in the other shell as well, if not just use ctrl+c on that shell and end the process. In my case, it stopped with GDB as shown in the screenshot below.
Conclusion
I hope you’ve enjoyed this blog post and learned something new today about payload analysis and debugging cross architecture in Kali Linux. Ready for another challenge? We post Mystery Challenges on Facebook, Linkedin, and Twitter. If you’re interested in security fundamentals, we have a Professionally Evil Fundamentals (PEF) channel that covers a variety of technology topics. We also answer general basic questions in our Knowledge Center. Finally, if you’re looking for a penetration test, professional training for your organization, or just have general security questions please Contact Us.