There are times when you need to capture some network traffic. Maybe you’re troubleshooting a communication issue or maybe you’re doing something a little more suspect on a penetration test (looking for that clear text communication floating on the network to a host). On top of needing a capture, you may not want to install a third party capture tool like Wireshark but you want to be able to open the capture file in Wireshark for the analysis. How can we do analysis without Wireshark? Fear not, Windows, Linux (at least most distributions), and macOS all come with utilities built in. For Linux and macOS that utility has been tcpdump for quite a while. Windows is a little more interesting
Replacing Windows Message Analyzer & Netmon
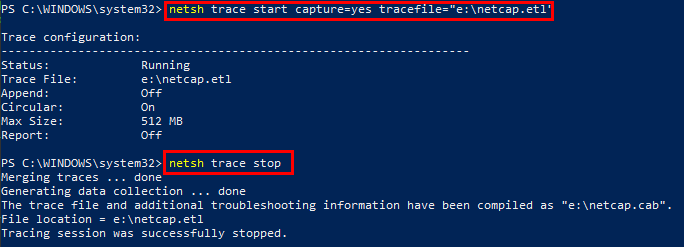
Windows used to have the netmon utility but it got dropped in 2010. At that point, Microsoft replaced netmon with Microsoft Message Analyzer, which then got dropped in 2019. What most people don’t know, however, is that since Windows 7 / 2008 R2 network capture functionality was included in the netsh command. The netsh command works a little differently than tcpdump, as you start a trace and it runs in the background until you tell it to stop.

Unfortunately, Microsoft had intended on people using Microsoft Message Analyzer to read the capture files, so they are .etl files that aren’t readable by Wireshark or other common utilities. Luckily, Microsoft has a conversion utility that can be downloaded from Github (https://github.com/microsoft/etl2pcapng). One side note about using netsh, network traces from netsh also include a .cab file containing other pieces of information you may not have wanted (such as event log exports, etc). This cab file could get rather large if you are taking a trace on a busy server.
Now that we have our capture utilities, let’s go over a handful of common capture examples. Both utilities require privileged access (sudo/root or administrator) to function. Please remember that with netsh, you will have to run netsh trace stop to stop the capture and then convert the file with etl2pcapng.exe (.\etl2pcapng.exe “e:\netcap.etl” “e:\netcap.pcapng”) before you can open it in Wireshark. In addition, you will see that I include two flags for tcpdump -s and -w. By default, tcpdump only captures a portion of each frame and -s 0 captures everything. Similarly, tcpdump only displays information on the screen unless you specify a file name which is through the -w switch.
Capture traffic on one interface:
- tcpdump -i eth0 -s 0 -w /mnt/e/netcap
- netsh trace start capture=yes CaptureInterface=”Local Area Connection” tracefile=”e:\netcap.etl”
Capture traffic to and from a host (in this case 192.168.137.198):
- tcpdump host -w /mnt/e/netcap 192.168.137.198
- netsh trace start capture=yes IPv4.Address=192.168.137.198 tracefile=”e:\netcap.etl”
Capture traffic from multiple hosts:
- tcpdump -s 0 -w /mnt/e/netcap host 192.168.137.198 or host 192.168.137.200
- netsh trace start capture=yes IPv4.Address=(192.168.137.198,192.168.137.200) tracefile=”e:\netcap.etl”
Only capture TCP traffic:
- tcpdump -s 0 -w /mnt/e/netcap tcp
- netsh trace start capture=yes Protocol=TCP tracefile=”e:\netcap.etl”
Capture DNS requests:
- tcpdump -s 0 -w /mnt/e/netcap port 53
- Port filtering is not an option with netsh trace
While netsh and tcpdump work differently, both can be invaluable tools for a variety of different situations, especially if you won’t or can’t use Wireshark right away. If you’re looking for more ways to level up your network security knowledge check out Proxies, Pivots & Tunnels, our Introduction to wireless security, or our Beyond Shell with Metasploit webcast.
