Did you know that Windows has a built-in network packet capture utility? And that it isn't even GUI based? It might surprise you, but administrators have been able to perform network captures from Windows systems for a very long time without installing Wireshark. Unfortunately, these built-in Windows utilities haven't always been the most user-friendly or intuitive, leading many users to seek out other options.
A Quick History
Way back when (like the 90s and early 2000s), administrators could install a GUI tool called Microsoft Network Monitor, better known as netmon. Although it required a reboot, it was part of the base Windows Components and easy to install. It worked well (but you could fill up disk space insanely fast if you didn't know what you were doing) and it gave Windows admins a method to see network traffic without getting other teams involved. Depending on the organization, installing it may have been against policy and a security risk as it highlighted that not all communications on an internal network were encrypted at the time (like potentially reading random emails in the traces...)
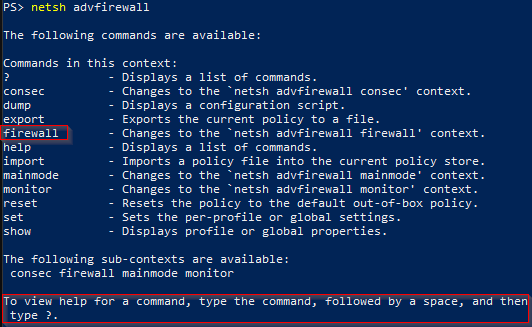
Late in 2009, Microsoft introduced the ability to start network captures using the command line in Windows Server 2008 R2 and Windows 7. This was done through the netsh command. Netsh was (okay it is still available to this day if you really want to use it) the command line utility for displaying and modifying the network configuration of a Windows device. Since the network capture functionality was tacked on to netsh, it was easy to miss the fact it existed but admins could now start a network trace without installing extra components. Any traces could be moved to a different device and viewed in netmon or other capture utility.
Then, with the introduction of Windows 2012, Microsoft expanded the options with netsh and then some PowerShell cmdlets with 2012 R2. While this was good, they switched output formats to a proprietary one, ETW (Event Tracing for Windows). This file could only be opened in the Microsoft Message Analyzer (MMA) program. It may have just been me, but this felt like a big step backward. MMA was a separate tool that you had to download and install, it felt slow, etc. Wireshark and other third party products were much better. You could load a netsh trace into MMA and convert it to other formats.
As development of MMA ended in 2016 and then it was removed from being downloadable in November 2019, I don't think I was alone in my thoughts. Luckily, Microsoft did release a tool, etl2pcapng, the same day MMA was pulled from the internet. But now you had to run a trace, copy the file across, convert it, and then load it into your third party tool (probably Wireshark). What makes this odd is that you didn't actually need to use this process; it's just that no one at Microsoft really told you what you should do.
Just like with Server 2008 R2, Microsoft silently offered a new network trace utility with Windows 10 and Windows Server 2019, Packet Monitor (pktmon). Pktmon was released with the October 2018 update to Windows 10, yet the last post stating that Microsoft Message Analyzer was no longer downloadable didn't mention pktmon. Unless you somehow found it, you were stuck using netsh and converting. Pktmon would also be backported into Server 2016.
Today
Now we have pktmon to capture traffic. Just like tcpdump on Linux, pktmon can display traffic or create capture files to view in GUIs like Wireshark. It is on every current Windows system and the only limitation to use it is that it must run in an administrative PowerShell or CMD window. The list of examples I have below is not exhaustive but enough to give you an idea of what it can do. More information can be found at Microsoft's pktmon documentation.
Start a Basic Network Capture
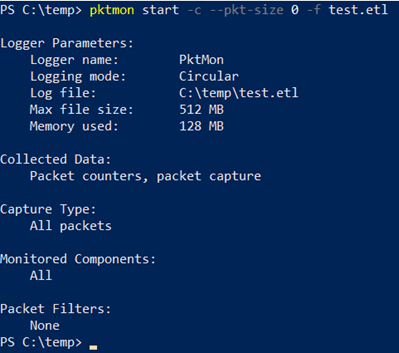
pktmon start -c --pkt-size 0 -f test.etl
Where -c captures packets, --pkt-size 0 collects the whole packet instead of just 128 bytes, and -f test.etl outputs to a file named test.etl in the current directory.
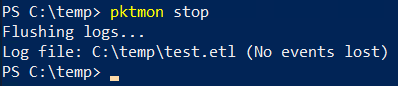
Stop Capturing Network Traffic
pktmon stop
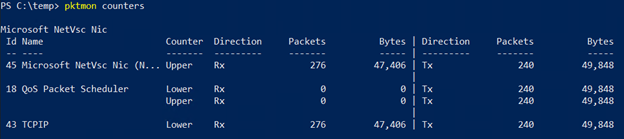
Display the Counters During a Capture
pktmon counters
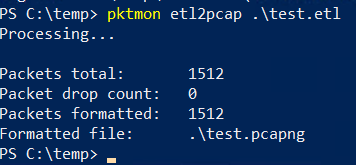
Convert the ETL File to View in Wireshark
pktmon etl2pcap .\test.etl
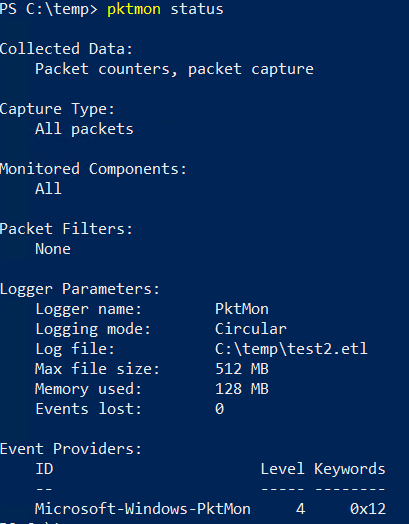
See if Pktmon is Running a Capture
pktmon status
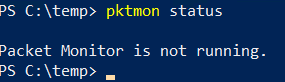
Or when no capture is running:
Real Time Display Like tcpdump
pktmon start -c -m rt
Where -c captures packets and -m rt sets the mode to real time.
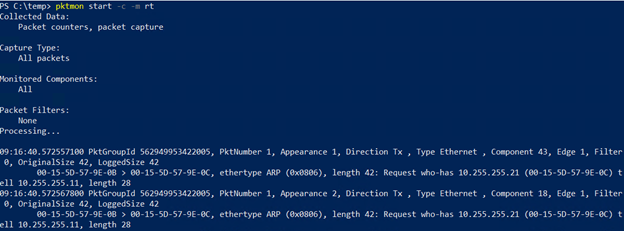
As you can see, having a large monitor helps as the spacing gets wonky if lines are wrapped.
Filtering Traffic to Capture
Pktmon can capture all traffic or be filtered to only capture traffic from specific IPs, networks, protocols, and ports. The filtering can be a little tricky as it must be set up before you start any captures and every filter in the list is an OR statement. To make a filter an AND statement, you have to include all the options in one filter.
For example, running the two commands separately would look for all traffic coming in over port 445 and all traffic from IP address 10.255.255.21.
pktmon filter add -p 445
pktmon filter add -i 10.255.255.21
You can see the filters by running the following command:
pktmon filter list
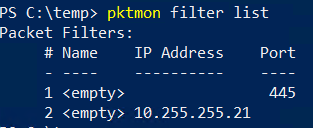
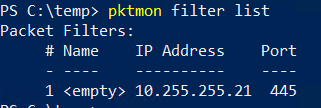
If you wanted to only see traffic to port 445 from 10.255.255.21, you specify it in one filter:
pktmon filter add -p 445 -i 10.255.255.21
As you can see, the filter looks different:
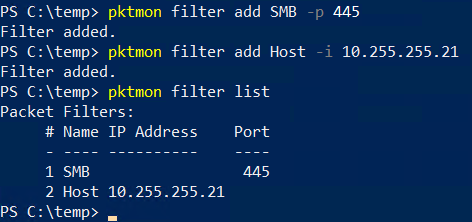
You can also add names to the filters by supplying it before the filter flag:
pktmon filter add SMB -p 445
You can remove filters, but it is all or nothing:
pktmon filter remove
Want more on working with capture data?
Once you have your captures, filtering and parsing the results is its own skill. Check out our guide to IP and port filtering for making sense of what you collect.
Read: Working With Data: IP and Port FilteringFinal Thoughts
Network captures may be considered more of a troubleshooting utility over a tool to be used for pentesting. However, I find there are times I want to see what traffic is actually floating around a network and being sent to or from specific devices. The built-in Windows tools make this accessible without additional software (i.e. living off the land). I find it especially useful when performing a test on a device of some kind. Turn on the Windows Mobile Hotspot, connect the device, and observe what traffic is being sent from it.
Curious what an attacker can see on your network?
Packet captures are just one piece of what our team uses during an internal penetration test. If you want to know what's exposed inside your environment, let's talk.
Let's Talk